Last time we walked through how to publish your account mappings and build/load the Accounts cube. Now you are ready to tackle the report blueprint!
The report blueprint is just as it sounds; a blueprint from which to build your financials. In this step we will define account groupings and signs(+/-).
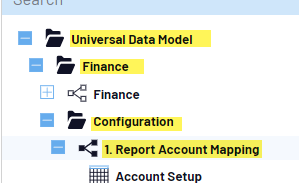
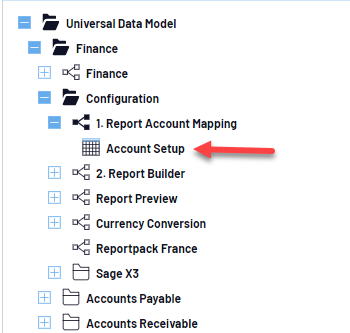
Begin by navigating to the ‘Report Builder’ process.
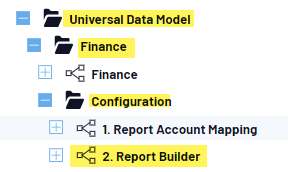
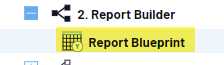
Expand this process and double click to open the ‘Report Blueprint’.
In this report, you will see groups defined in the first column. There are default groups which you can utilize or create your own. To create your own, we will utilize the info pages.
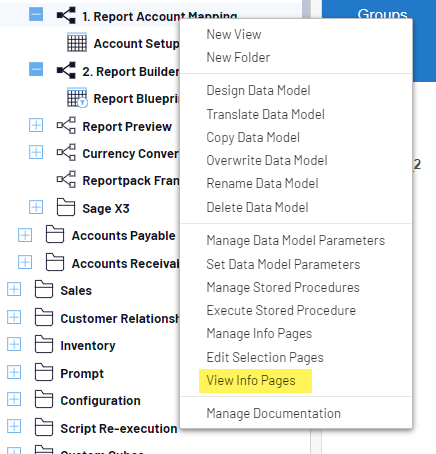
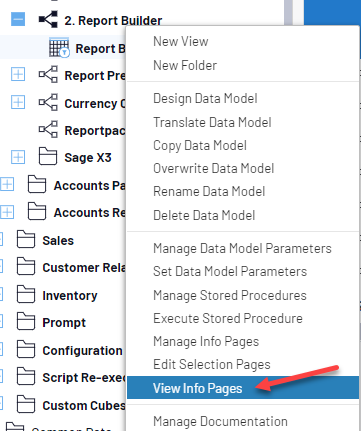
Right click on the Report Builder process and choose ‘View Info Pages’
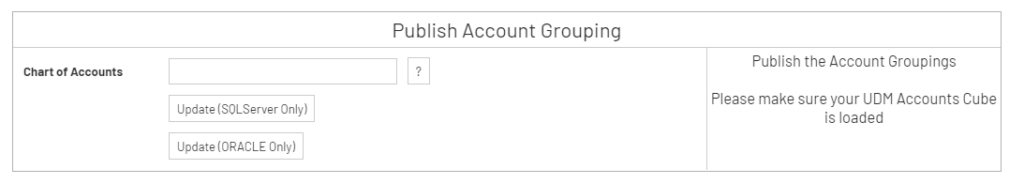
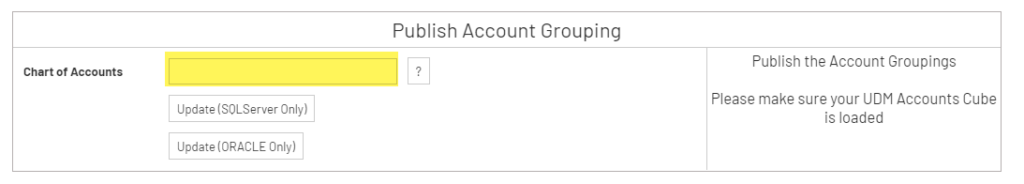
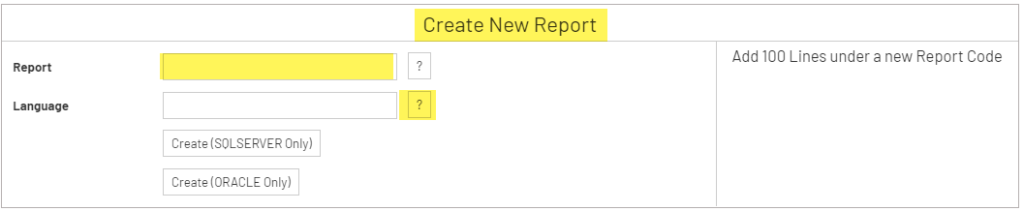
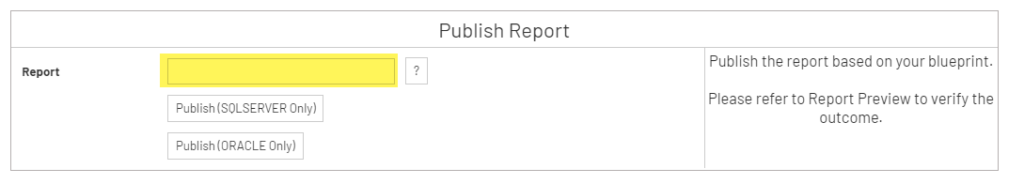
Here we are going to utilize the ‘Create New Report’ section. Enter a report code and choose a language. Depending on your database, choose the SQL Server only option or the ORACLE only option.
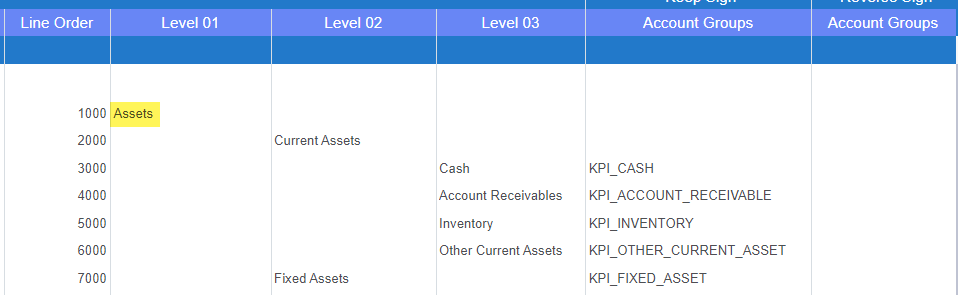
Open the Report Blueprint to see your new report code. In this report you will define the account groupings. For example, our first level (Level 01) is the general account name: Assets.
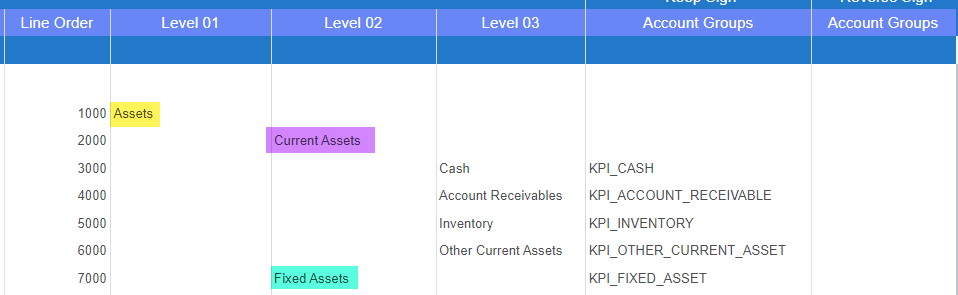
Our Assets account can then be divided into Current Assets and Fixed Assets (Level 02).
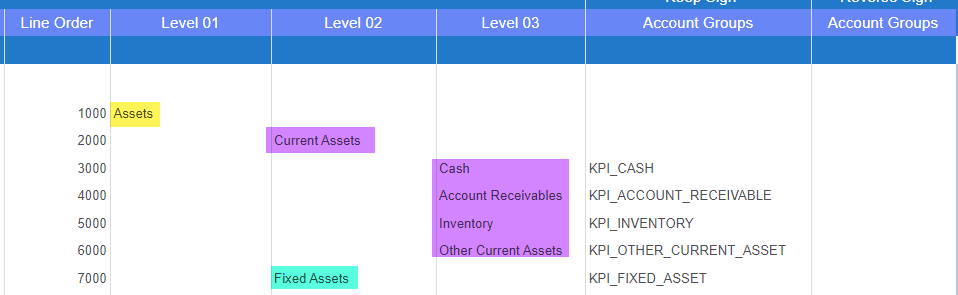
You may stop here, or maybe you need to get more granular. In Level 03 you can see we break up Current Assets into Cash, Accounts Receivables, Inventory and Other Current Assets. The Fixed Assets definition stops at Level 02.
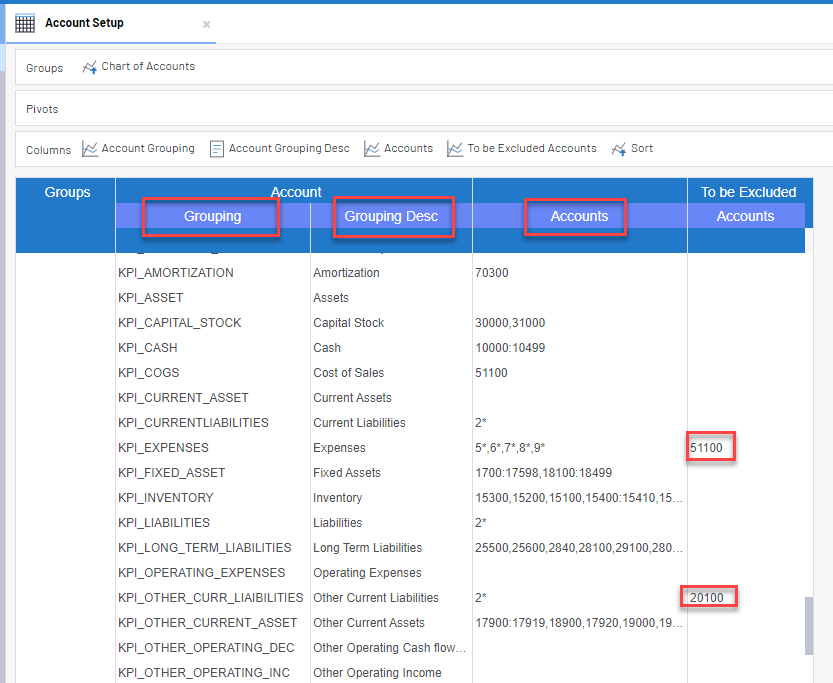
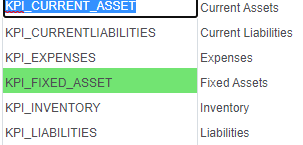
So now we have our levels defined, next step is to associate the account groups. These groups come from the Account Mapping report. A group will be placed in either the ‘Keep Sign’ or ‘Reverse Sign’ column.
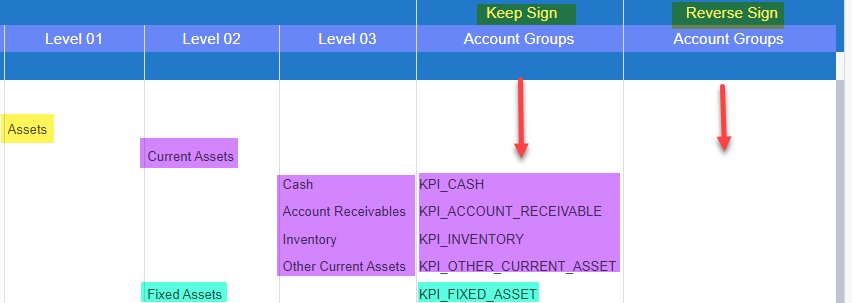
In our example, the account groups for Current and Fixed Assets are in the ‘Keep Sign’ column. The previous steps will be repeated for you other account groupings.
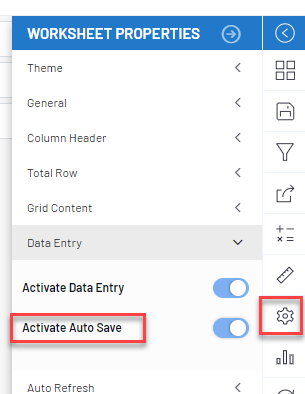
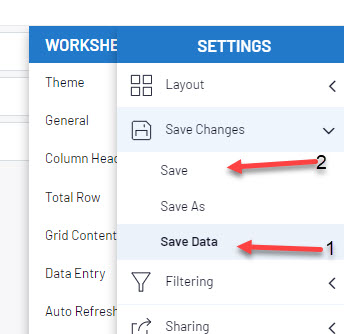
After everything is mapped here, we must save the data and publish the report as we did for the Account Mapping report.
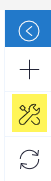
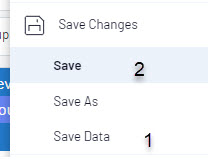
To do this, click on the save disk, ‘Save Data’ then ‘Save’.
Close the report. Right click on the Report Builder Process and choose ‘View Info Pages’. Fill in the Report field with your report code and click the update button that matches your database (SQL or ORACLE).
Now you are ready to begin creating your Financial reports!