The Universal Data Model(UDM) elegantly allows a user to create consolidated reports that use multiple data sources. This means, you can create a comprehensive report with details from finance, sales, inventory, CRM, etc without having to run multiple reports and manually compile the data.
Having access to this data on the web empowers users to view their data when and as often as they want. Users also have the advantage of their data being live and up to date.
A great way in which to utilize this powerhouse feature would be to create an executive level report that highlights the KPI’s of the business. Viewing this data online allows it to be organized in an engaging and appealing format that users can easily navigate online or export and print.
Not all relevant values come from X3; some values may come from outside the system such as available credit from the bank or expected receivables. In SEI V9 you can create a template to enter these values manually and store it in a place where it can be later used to compare to other information that comes from X3.
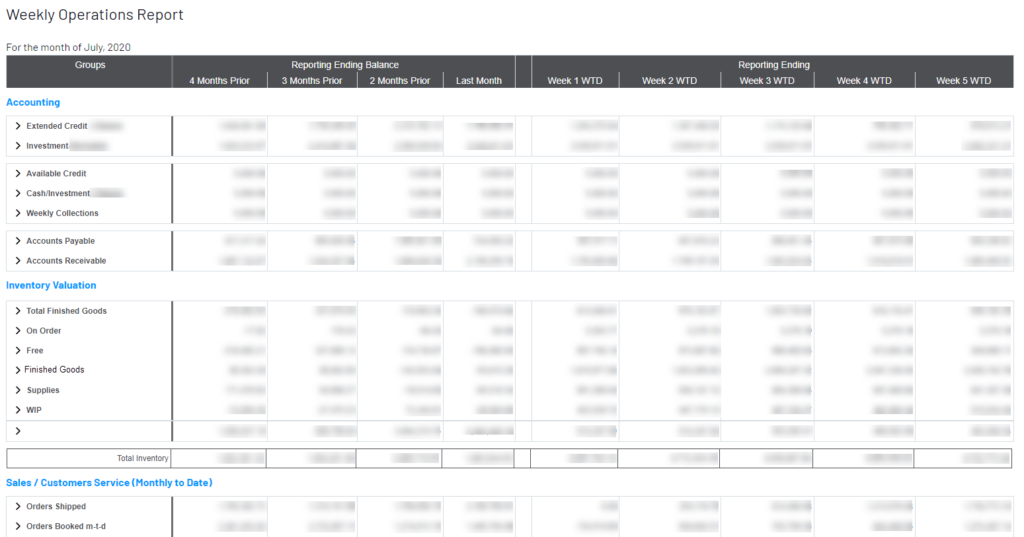
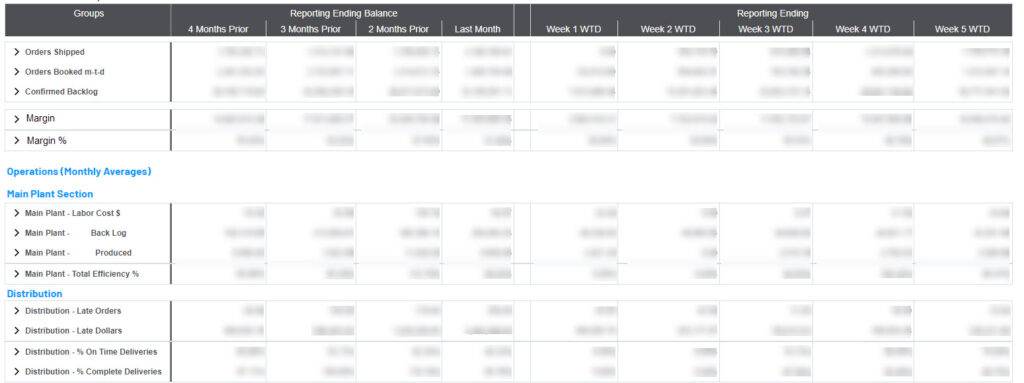
Below is an example of what is possible. This report displays the four prior month’s values and divides the current month into weekly values.


This is an example of a customer report that takes key financial information, e.g. AP/AR, available cash and combines it with orders created, orders shipped and the backlog of orders then combines all of that with labor information, e.g. labor cost, efficiency, units produced.
SEI V9 includes many useful out of the box reports and dashboards. Follow this blog as we begin to explore more of them in detail.
If you’d like a demo of V9 or have questions, contact us (412) 226-3086 or admin@rebdev.com with details of your project request.
