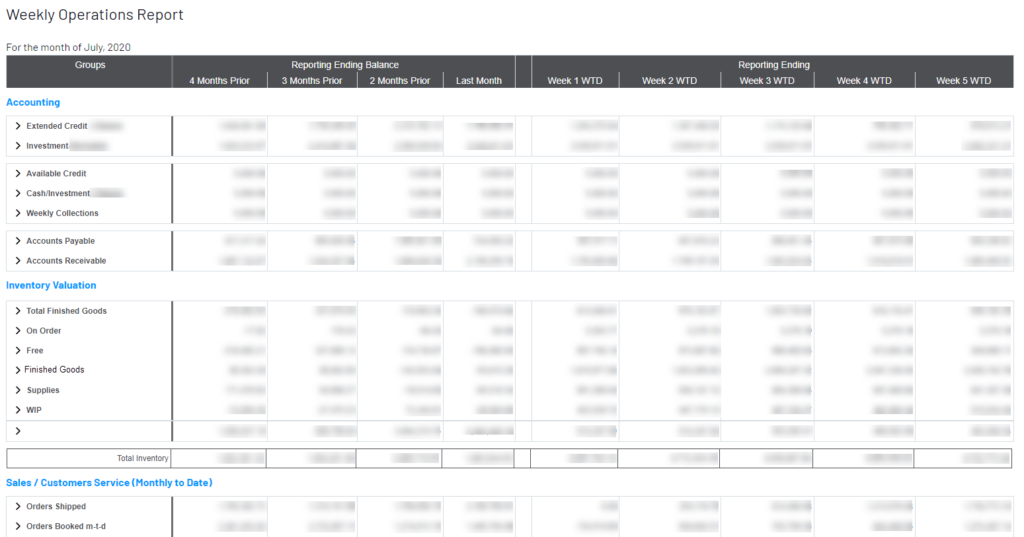
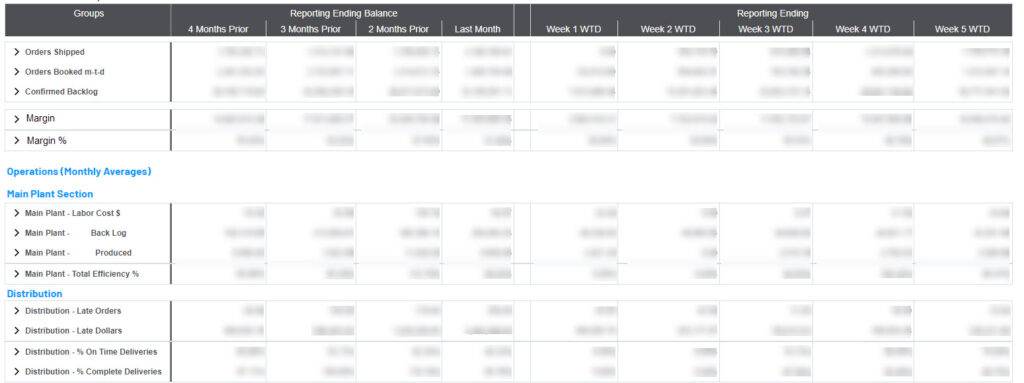
The UDM is a powerful feature that allows a user to create consolidated reports that use multiple data sources. This means, you can create a comprehensive report with details from sales, inventory, CRM, etc!
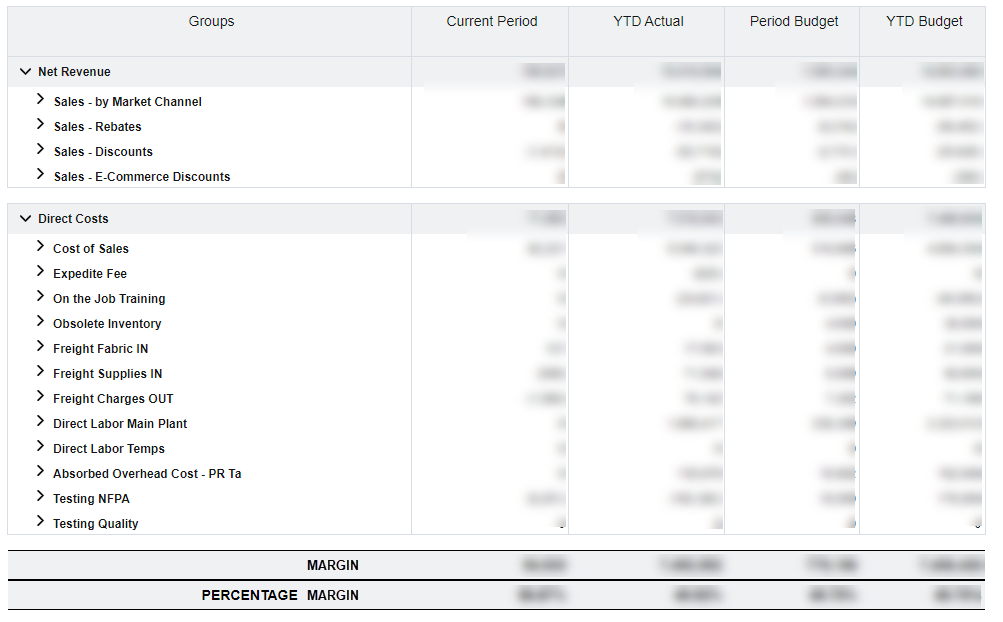
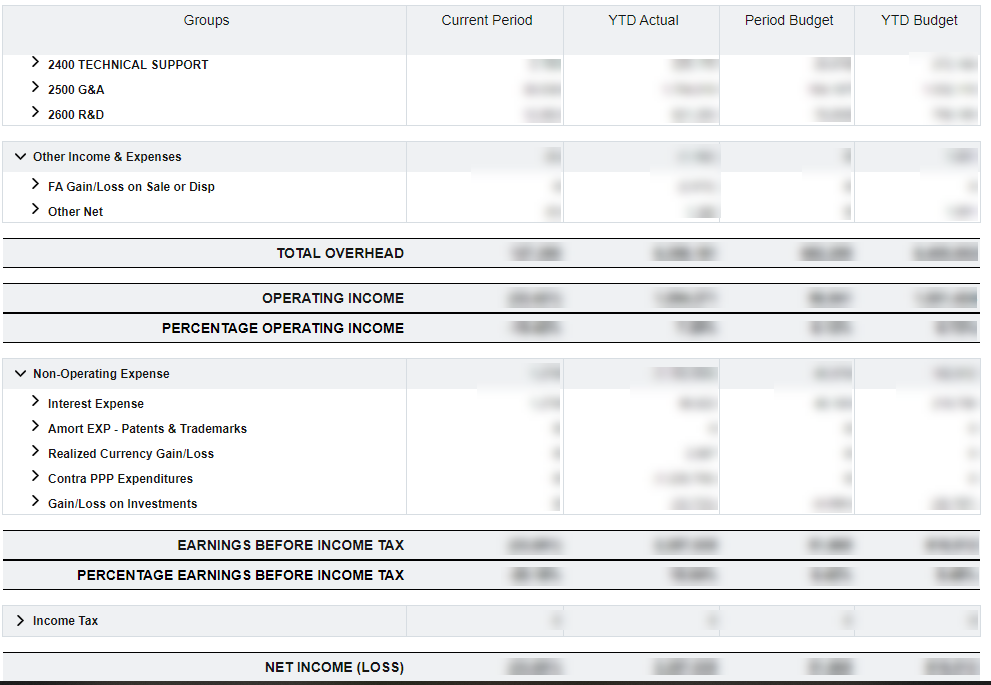
In a previous blog(Financials on the Web), I showed you what was possible to create using the UDM. In this post, and the following, I will break down the steps to create your financials on the web.
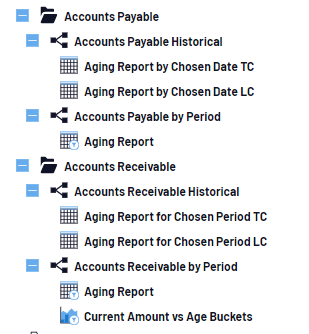
While there are various out of the box reports, it is advantageous to configure the cube to what you need and create your own reports.
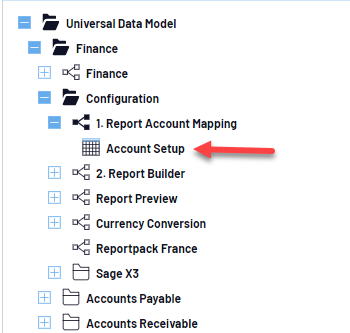
Start by mapping your accounts. Navigate to the Universal Data Model folder > Finance > Configuration > Report Account Mapping > Account Setup
Double click to open this view and begin mapping your accounts. Default accounts have been defined but you may define your own. Start by entering the group/account name, i.e., WIP_Inv. Then enter in the account description, i.e. WIP Inventory, and the account numbers associated. If there are accounts to be excluded, those can be defined as well
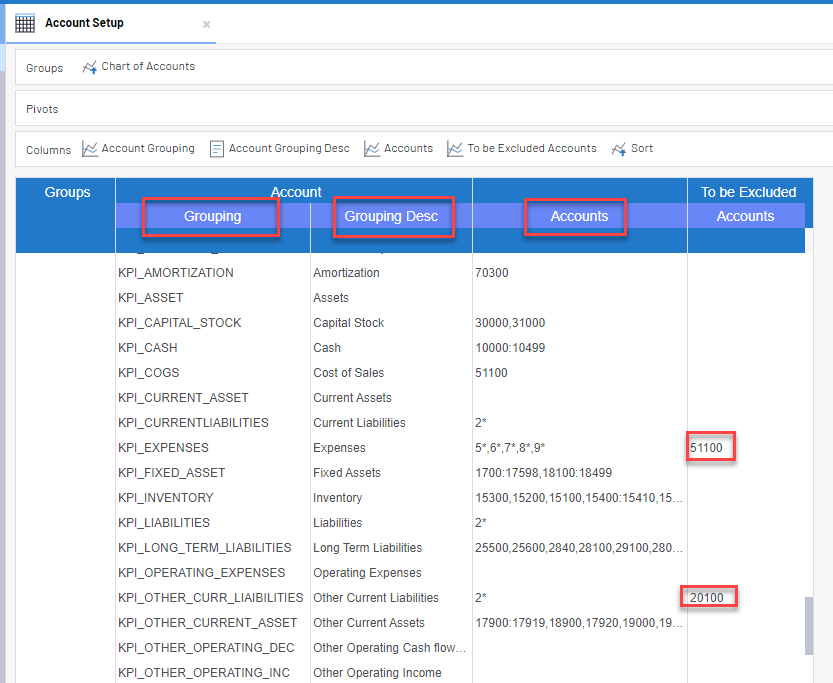
When defining accounts, here are a few ways to list them. If you want to include every account that begins with a ‘2’, type 2*
If you’d like to define a range of accounts, type the beginning account and ending account to include, separated by a ‘:’
You can also simply define each account number separated by a comma
These rules also apply for accounts to exclude.
As you are making changes, be sure to save your work! Under worksheet properties, auto save can be toggled on so that changes are saved to the view as they are made.
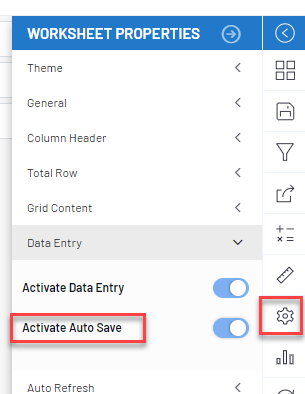
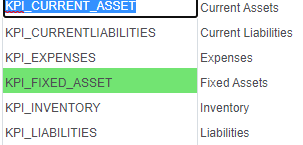
Otherwise, changes will appear highlighted in green and you must manually save the view.
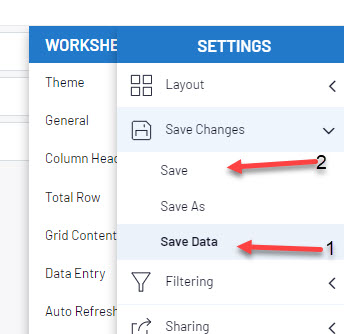
If manually saving, two steps must be taken. The first is ‘Save Data’ then ‘Save’. If ‘Save Data’ is not first clicked, your data entered will not be saved.
Defining your account set up is the first step to take in utilizing the Finance UDM, whether you are going to use the standard reports, or create your own.
Check back to see the next step!