What’s new in SEI V9

In this article I’ll highlight some of the changes and updates to the reporting tool.

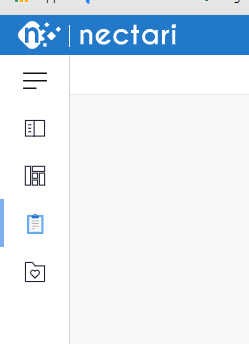
V9 of SEI comes with multiple updates and advantages. First, you’ll notice the color change. The interface is now a pleasant blue and white, which mimics the color scheme of Sage X3 v12. You’ll then notice some of the icons and labels have been updated as well.

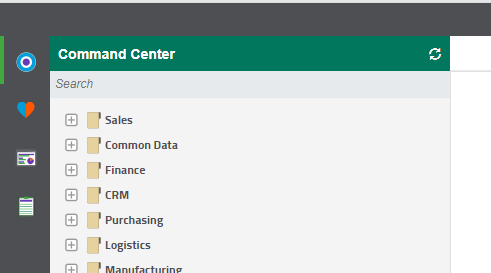
In the command center you’ll notice the extra 3 lines button at the top now. This allows you to expand or collapse the side panel. Next you’ll notice that the icon have changed & shifted positions. Looking at V9, going down the panel, you now have the Data Models and Views, Dashboards, Reports, and Favorites.

SEI V9 Command Center
SEI V8 Command Center

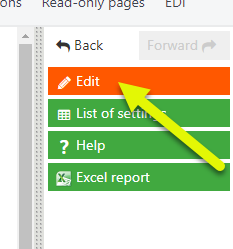
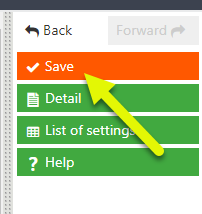
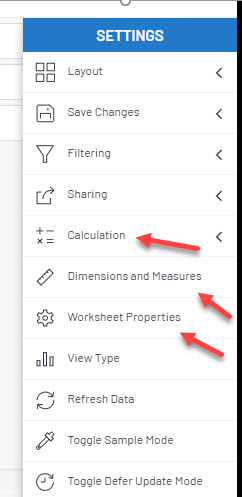
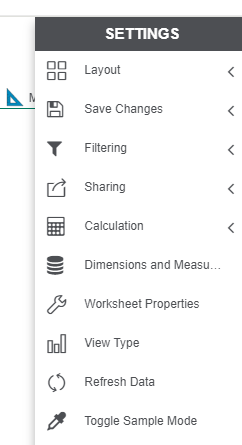
Icons and name changes were also made to the report tools. Looking at V9, you’ll see the calculation option has changed to operations signs, Dimensions and Measures icon has changed to a ruler, and the Worksheet Properties option has changed to a gear.

SEI V9 Report Tools
SEI V8 Report Tools

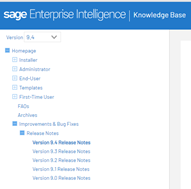
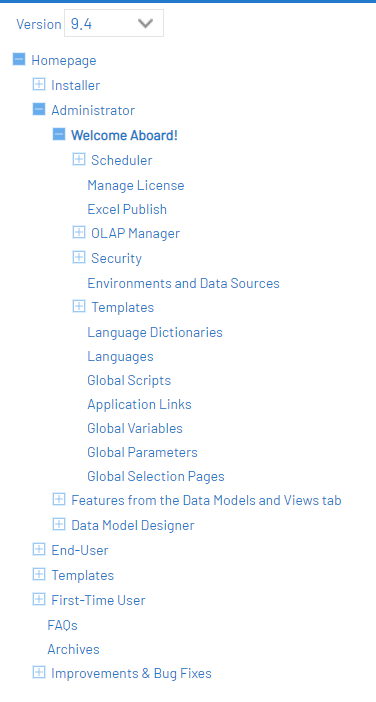
Along with some cosmetic changes, new features and reports have been added as well. First, documentation has moved online making it easier to find what you need.

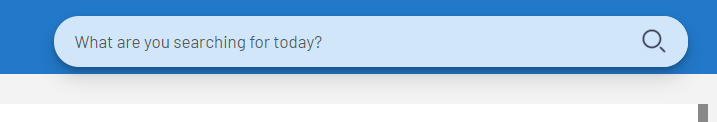
On the left you’ll find an easy to navigate index of topics and a search bar on the top right

Next, let’s look at what’s new with the reports (Views). You can now add images and HTML links into worksheets. They’re even exported when sharing a worksheet to excel.

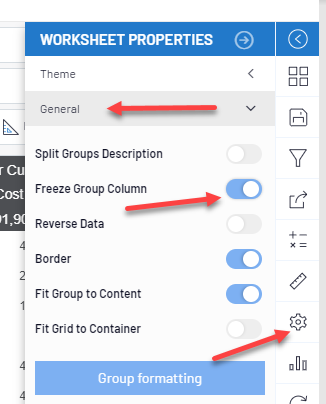
A freeze group column property has been added allowing the groups column to stay in place while scrolling to the right.

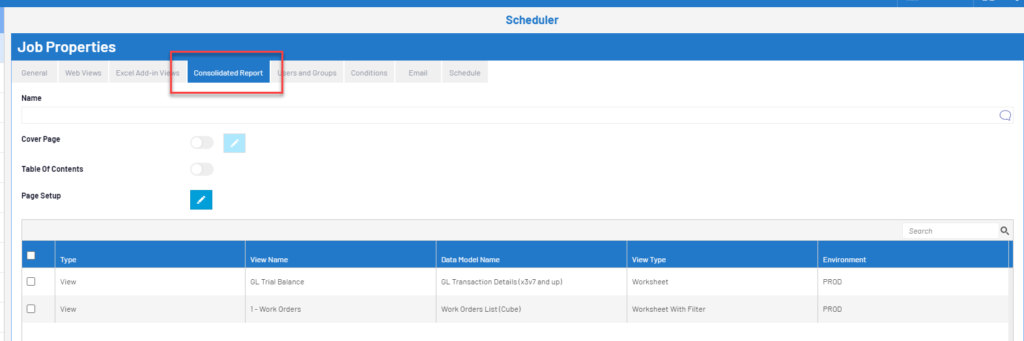
Lastly, lets look at the report scheduler. If you’re not using this feature, you should! It allows reports to be sent out on a schedule for ease of visibility and use. Before version 9, a scheduled job had to be created for each report to send. However, now, you can define multiple reports to send per job, making the process more efficient and allowing the recipient to see all of their reports in one place. Simply add all of the reports in the ‘Web Views’ tab and then manage them in the ‘Consolidated report” tab.

For more features check out the SEI Knowledgebase (https://onlinehelp.sageenterpriseintelligence.com/Latest/en/Home.htm) or contact us at (412) 226-3086 or admin@rebdev.com.

How to Update Customer Email Addresses

In Sage X3 is possible to store customer contact information by ship to address. Sometimes customer contacts change or information needs updated.

Customer emails can be added/ updated by navigating to Common Data> BPs> Customers

Choose your customer from the left list and navigate to the Addresses tab

Choose from the list of address

Scroll to the bottom of the tab to the Email block. Here you can enter email addresses

How to Change the Expiration Date Reference in the Lot Mass Change Function

When entering an expiration date in the Lot Mass Change function or Characteristics change function, the year might default to 19xx. For example, you might set the date to 3/1/30 but the date then defaults to 3/1/1930 when you meant 2030. This causes your lot to be expired and unusable!

To resolve this, navigate to Administration> Administration> Global Settings

Click “Edit” on the right hand panel

Change the upper bound of two digit year expansion interval field to your desired year

Click “Save” on the right hand panel.

Now when 3/1/30 is entered, the date will display as 3/1/2030

How to create a browser object with filter criteria

Sometimes the left list in a function can be a bit overwhelming when it contains every record. Did you know it’s possible to created another left list that contains only the data you need? Below are the steps to create a browser object with filter criteria. By following these steps a ‘drawer’ or ‘tab’ on the left list will be created making it quicker and more simple to find the records you need to see.

Navigate to Development > Script Dictionary > Objects

Click ‘New’ to start a new record

Give your object an identifying code & a description. Use the selection icon to choose a linked table

On the General tab, give your object an activity code and choose ‘Browser’ as the management type.

Also on the General tab, make sure your standard & specific script names populate. You will need the specific script name later.

Usually on an object you pick, from the linked table, which fields to display, as below. The SOH object, for example, in the selection screen block, you would define an index (SOH0) then specify a table and field from that table to display. For our browser object, we will do this in the specific script.

Click the ‘Create’ button to create your object.

Create your specific script and add the following piece of code to the Action label:

When "CLE_GAUCHE" : Gosub CLE_GAUCHE  

This action is called before loading the left list

Next, create the action label block:

$CLE_GAUCHE 
return

This is where you will define the filter criteria for your left list drawer by using the variable ‘FILTSUP’. The filter criteria is expressed in a string with logic to combine criteria. See below for an example.

FILTSUP = 'SOHCAT = 4'

This will filter the left list for sale orders that are categorized as contract types. If you need a more complex filter see how to add more criteria below.

FILTSUP = '(SOHCAT = 4 OR SOHCAT = 3) AND CPY = 111'

This would filter the left list for sale orders categorized as contracts or direct invoice and also looking for the company to be ‘111’.

 ###########################################

$ACTION

Case ACTION

         When “CLE_GAUCHE : Gosub CLE_GAUCHE

Endcase

###########################################

$CLE_GAUCHE

FILTSUP=FILTSUP = '(SOHCAT = 4 OR SOHCAT = 3) AND CPY = 111'

Return

###########################################