In this article I’ll highlight some of the changes and updates to the reporting tool.
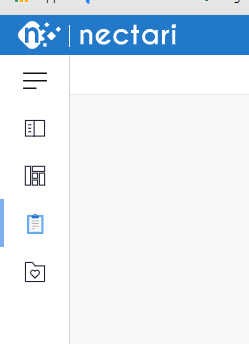
V9 of SEI comes with multiple updates and advantages. First, you’ll notice the color change. The interface is now a pleasant blue and white, which mimics the color scheme of Sage X3 v12. You’ll then notice some of the icons and labels have been updated as well.
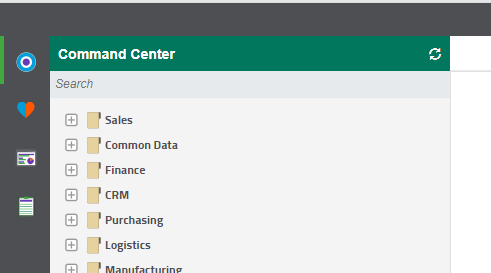
In the command center you’ll notice the extra 3 lines button at the top now. This allows you to expand or collapse the side panel. Next you’ll notice that the icon have changed & shifted positions. Looking at V9, going down the panel, you now have the Data Models and Views, Dashboards, Reports, and Favorites.


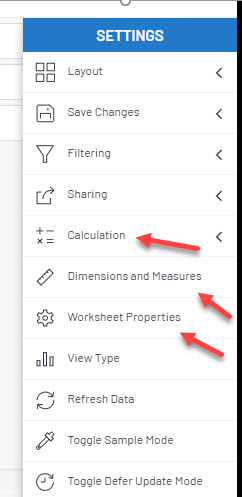
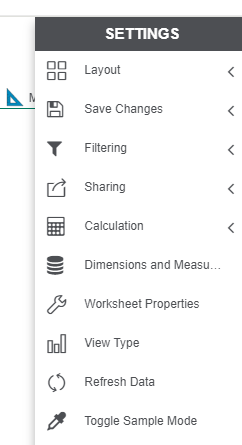
Icons and name changes were also made to the report tools. Looking at V9, you’ll see the calculation option has changed to operations signs, Dimensions and Measures icon has changed to a ruler, and the Worksheet Properties option has changed to a gear.


Along with some cosmetic changes, new features and reports have been added as well. First, documentation has moved online making it easier to find what you need.
On the left you’ll find an easy to navigate index of topics and a search bar on the top right


Next, let’s look at what’s new with the reports (Views). You can now add images and HTML links into worksheets. They’re even exported when sharing a worksheet to excel.
A freeze group column property has been added allowing the groups column to stay in place while scrolling to the right.

Lastly, lets look at the report scheduler. If you’re not using this feature, you should! It allows reports to be sent out on a schedule for ease of visibility and use. Before version 9, a scheduled job had to be created for each report to send. However, now, you can define multiple reports to send per job, making the process more efficient and allowing the recipient to see all of their reports in one place. Simply add all of the reports in the ‘Web Views’ tab and then manage them in the ‘Consolidated report” tab.

For more features check out the SEI Knowledgebase (https://onlinehelp.sageenterpriseintelligence.com/Latest/en/Home.htm) or contact us at (412) 226-3086 or admin@rebdev.com.

