Financials on the Web
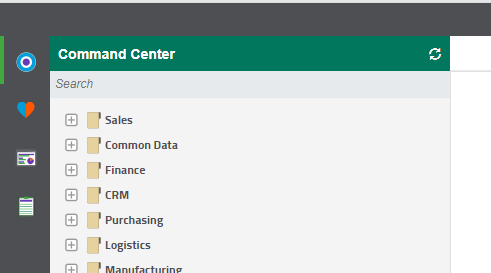
SEI V9 comes with many improvements including the Universal Data Model(UDM). The UDM allows you to create comprehensive reports using data from various sources(sales, inventory, etc).
Free your financial data. Creating financials on the web allows executives and senior staff members to have a comprehensive look at the company’s financial position while allowing for the flexibility to see current and past data.
Financials on the web means you can view your data on the go! No more refreshing excel workbooks, understanding formulas or waiting on coworkers to update excel workbooks .
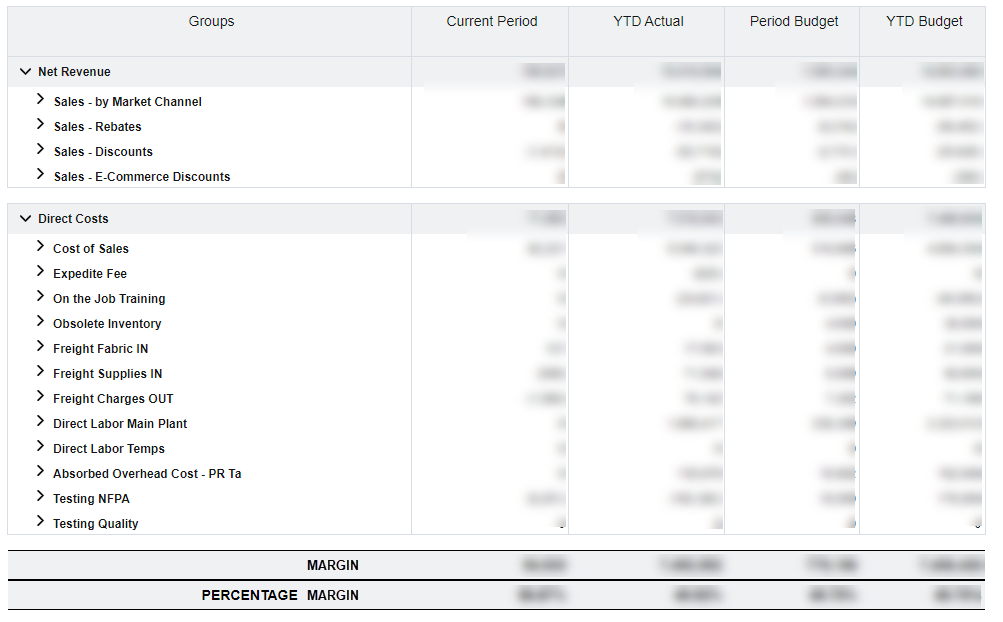
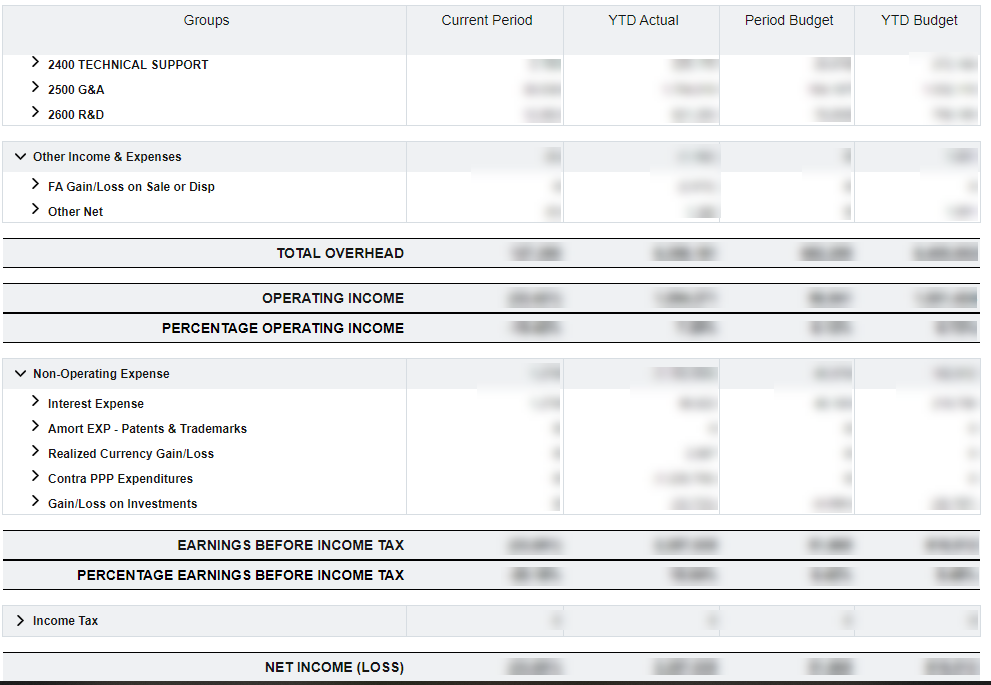
Executive staff members, not normally working in excel, could have easy, instant access to important information, used to make key business decisions, like a balance sheet & income statement.
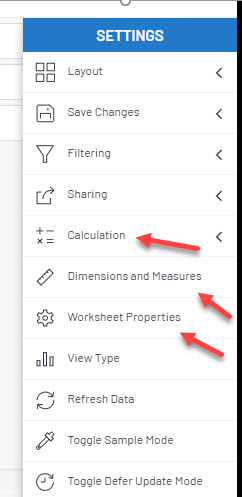
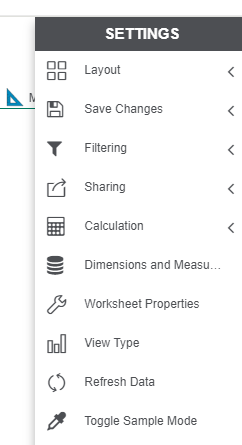
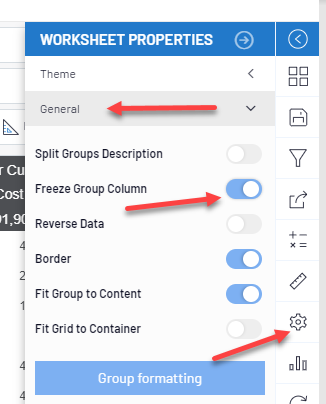
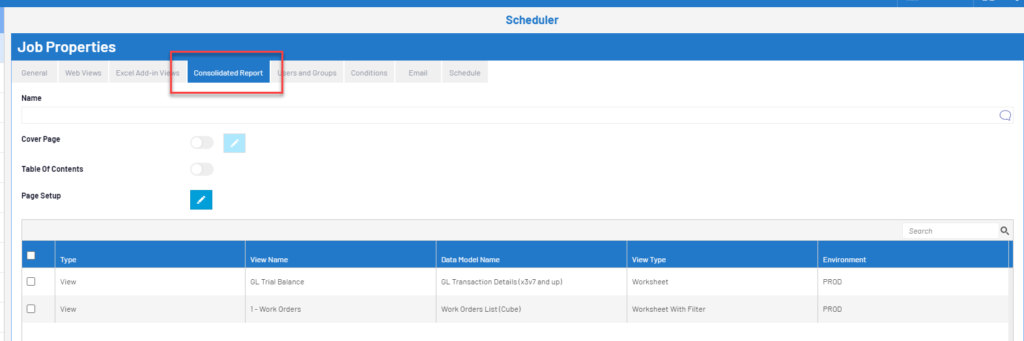
User also have the ability to drill down to different dimensions and details or roll up multiple accounts on same line. Financials come print ready so no time is needed to make them pretty. Easily export to excel/pdf or use the SEI distribution service to have them emailed on a schedule to appropriate team members.
Utilize the new budget entry tools available with SEI V9 to allow users to enter budgets and submit them for review. Also include a side by side budget with ease.
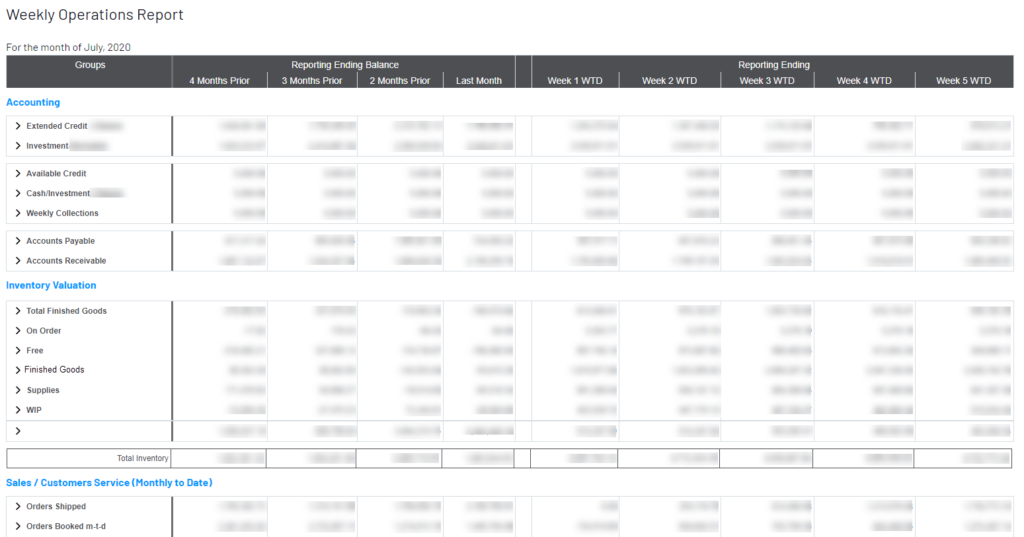
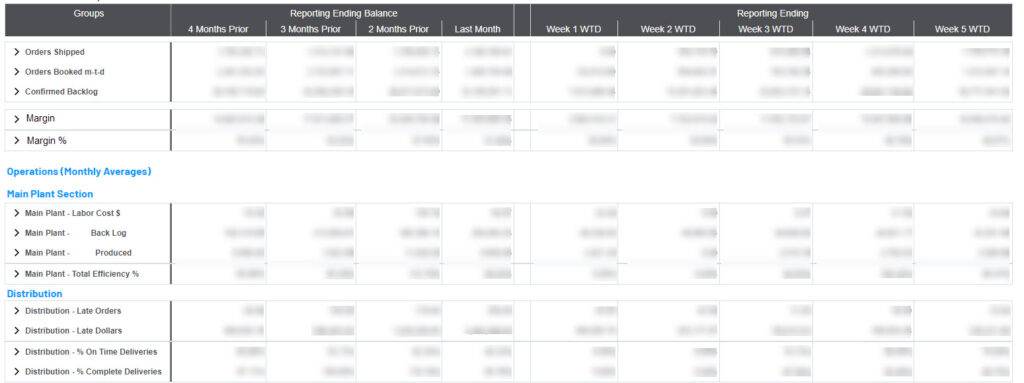
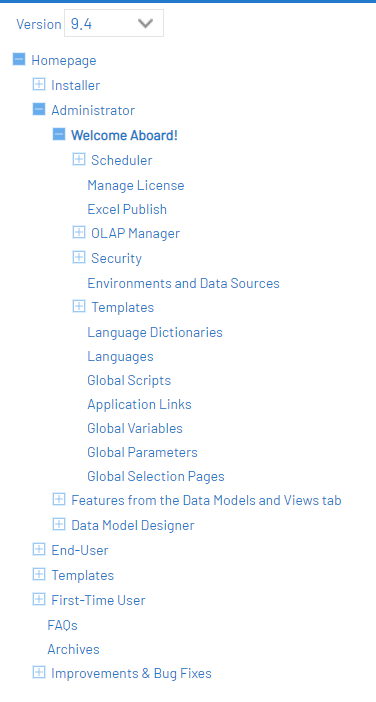
Below is an example of what is possible.
Check back later this week for more details on what’s possible with the finance UDM.
If you’d like a demo of V9 or have questions, contact us at (412) 226-3086 or admin@rebdev.com.