Month End- Checks & Validations Pt. 3

Today we’ll look at 3 more ways to verify that all entries have been posted.
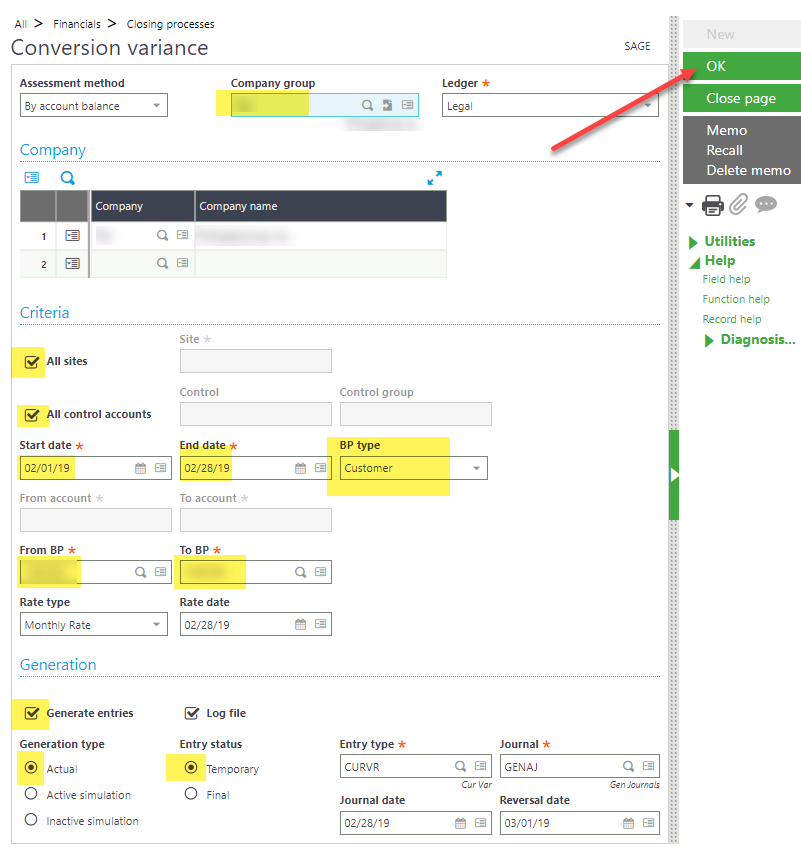
  1. Conversion Variance
    • This function creates entries to offset variances due to exchange rates so that accounts will balance
      1. Navigate to Financials > Closing processes > Conversion variance (ACCCURCNV)
      2. Choose the Company group for which to preform the conversion
      3. Check ‘All Sites’
      4. Check ‘All Control Accounts’ or define the accounts
      5. Set the date range for the fiscal period
      6. Choose one BP or a range
      7. Ensure ‘Generate entries’ is marked, generation type is ‘Actual’ and Entry status is ‘Temporary’
      8. This function is most commonly run for BP type Customer and BP type Supplier
      9. Click OK
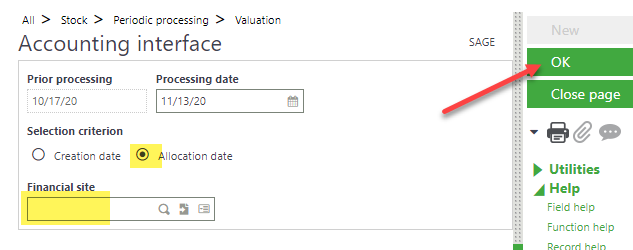
  2. Stock Accounting Interface
    • Use this function to create entries for stock movements/transactions and update values of stock. When sales deliveries, purchase receipts, stock movements and similar transactions are created, the GL is not updated until this function is run.
      1. Navigate to Stock > Periodic processing >Account Interface (FUNSTKACC)
      2. Selection Criteria should be set to ‘Allocation Date’
      3. Financial site can be left blank to run this for all companies
      4. Click OK
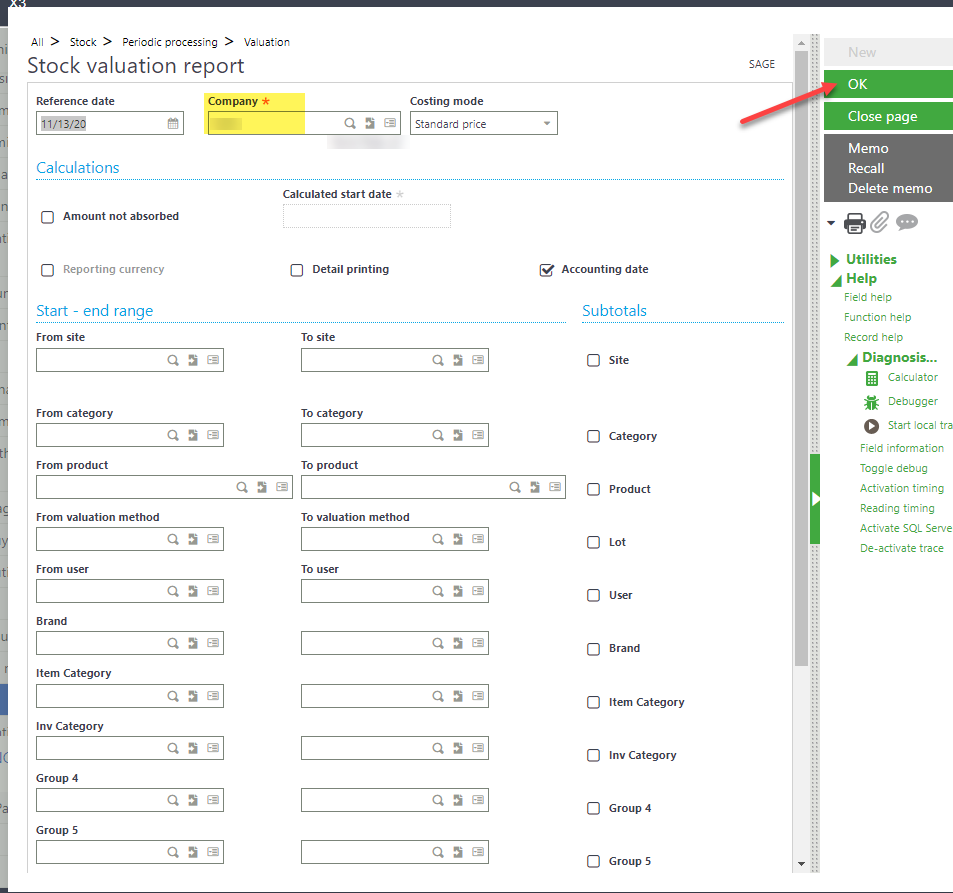
  3. Stock Valuation Report
    • Run this report to use a check to confirm stock values are what you are expecting
      1. Navigate to Stock > Periodic processing > Stock valuation report (FUNSTVA)
      2. Choose the Company to run the report for
      3. You may define other parameters but it is not necessary
      4. Click OK. This will bring you to a screen from which you can print the report

Tune in next time to read about the final step in validating and checking for month end closing!

What’s New in SEI V9: Finance UDM Pt. 3

Last time we walked through how to publish your account mappings and build/load the Accounts cube. Now you are ready to tackle the report blueprint!

The report blueprint is just as it sounds; a blueprint from which to build your financials. In this step we will define account groupings and signs(+/-).

Begin by navigating to the ‘Report Builder’ process.

Expand this process and double click to open the ‘Report Blueprint’.

In this report, you will see groups defined in the first column. There are default groups which you can utilize or create your own. To create your own, we will utilize the info pages.

Right click on the Report Builder process and choose ‘View Info Pages’

Here we are going to utilize the ‘Create New Report’ section. Enter a report code and choose a language. Depending on your database, choose the SQL Server only option or the ORACLE only option.

Open the Report Blueprint to see your new report code. In this report you will define the account groupings. For example, our first level (Level 01) is the general account name: Assets.

Our Assets account can then be divided into Current Assets and Fixed Assets (Level 02).

You may stop here, or maybe you need to get more granular. In Level 03 you can see we break up Current Assets into Cash, Accounts Receivables, Inventory and Other Current Assets. The Fixed Assets definition stops at Level 02.

So now we have our levels defined, next step is to associate the account groups. These groups come from the Account Mapping report. A group will be placed in either the ‘Keep Sign’ or ‘Reverse Sign’ column.

In our example, the account groups for Current and Fixed Assets are in the ‘Keep Sign’ column. The previous steps will be repeated for you other account groupings.

After everything is mapped here, we must save the data and publish the report as we did for the Account Mapping report.

To do this, click on the save disk, ‘Save Data’ then ‘Save’.

Close the report. Right click on the Report Builder Process and choose ‘View Info Pages’. Fill in the Report field with your report code and click the update button that matches your database (SQL or ORACLE).

Now you are ready to begin creating your Financial reports!

What’s New in SEI V9- Financials on the Web

Financials on the Web

SEI V9 comes with many improvements including the Universal Data Model(UDM). The UDM allows you to create comprehensive reports using data from various sources(sales, inventory, etc).

Free your financial data. Creating financials on the web allows executives and senior staff members to have a comprehensive look at the company’s financial position while allowing for the flexibility to see current and past data.

Financials on the web means you can view your data on the go! No more refreshing excel workbooks, understanding formulas or waiting on coworkers to update excel workbooks .

Executive staff members, not normally working in excel, could have easy, instant access to important information, used to make key business decisions, like a balance sheet & income statement.

User also have the ability to drill down to different dimensions and details or roll up multiple accounts on same line. Financials come print ready so no time is needed to make them pretty. Easily export to excel/pdf or use the SEI distribution service to have them emailed on a schedule to appropriate team members.

Utilize the new budget entry tools available with SEI V9 to allow users to enter budgets and submit them for review. Also include a side by side budget with ease.

Below is an example of what is possible.

Check back later this week for more details on what’s possible with the finance UDM.

If you’d like a demo of V9 or have questions, contact us at (412) 226-3086 or admin@rebdev.com.